There are few things that I have put off learning more than Digital Signal Processing (DSP), namely because it sounded really hard, and really maths-heavy. But recently I have been learning the basics alongside some projects involving the RTL-SDR, the $40 USB Dongle to explore the spectrum.
The unfortunate truth is that there is some amount of maths that is unavoidable in DSP, the main prerequisite being the intuitive understanding of complex numbers, it really helps with wrapping your head around.
If you just want to explore the spectrum, and mess with your SDR, software like SDR++ exists for just that, it implements all of these DSP elements so that you can play with your Software Defined Radio as if it were a radio.
The Complex Wave
Sampling
Due to the fact that we live in the real world, we must convert continuous-time signals into discrete-time samples because digital systems can only process time- and amplitude-quantized data. That means sampling an analog wave with an ADC millions of times per second.
I/Q
In DSP, a wave is usually represented as a series of samples with 2 components,
- I: In-phase component (aligned with the reference oscillator)
- Q: Quadrature component (90° phase-shifted)
Any sinusoidal waveform, modulated in amplitude, frequency, or phase, can be represented using I/Q samples. When you treat them together as a single complex number:
$$ z[n]=I[n]+jQ[n] $$…you can represent both the amplitude and phase of the signal at each point in time. This complex representation is referred to as the complex baseband - meaning the signal has been shifted down from its radio frequency (RF) carrier to a lower frequency centered around DC (0 Hz). Processing a signal at a complex baseband dramatically simplifies things.
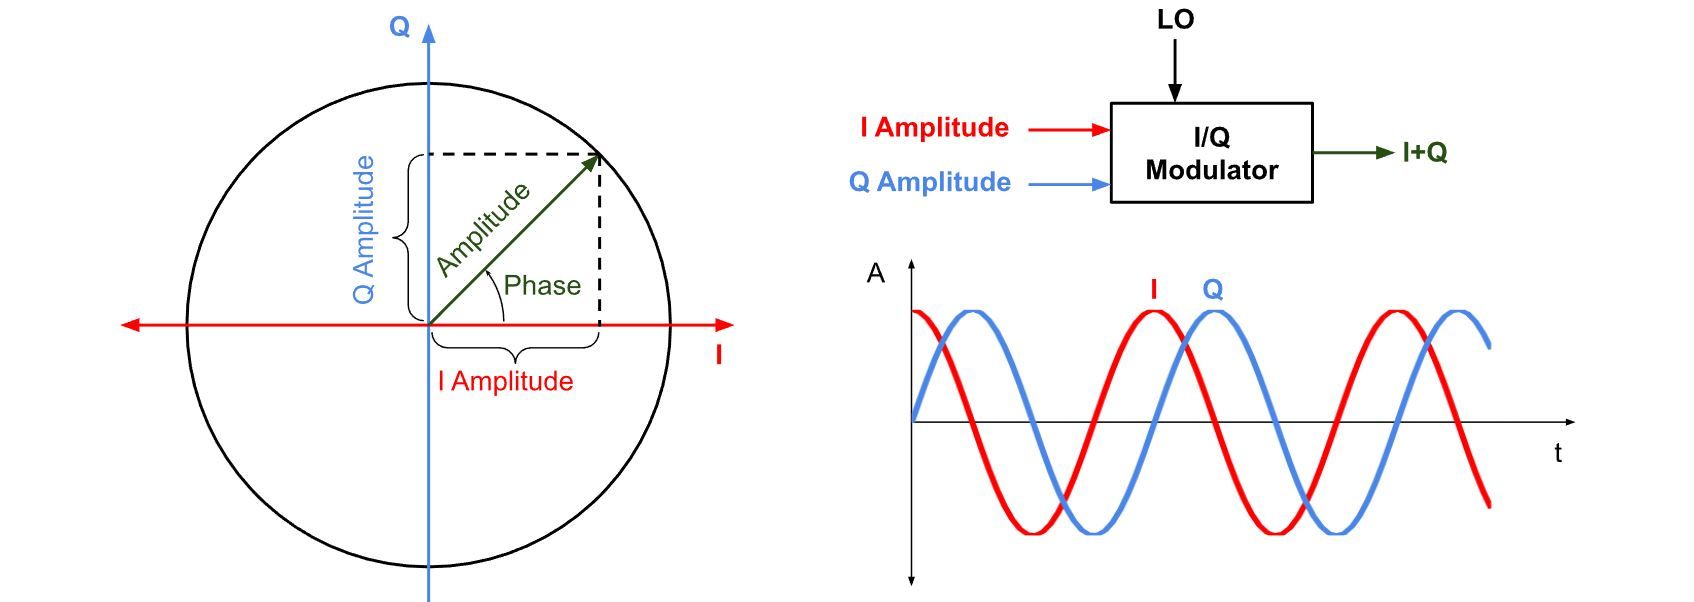
A nice way to gain a more intuitive understanding of the I/Q elements of a wave, and how meaning (modulation) can be derived is through a phasor diagram, where we simply plot I and Q values directly to a graph. You can imagine a single frequency of wave would spin around the graph.
- FM: Changes in frequency make the point speed up or slow down.
- AM: The point still rotates, but its distance from the origin varies.
 Phasor Diagram taken from https://www.todo-sdr.com/funcionamiento-sdr/
Now we can express amplitude, frequency, and phase all in a single term. This makes modulation and demodulation (especially FM/PM) much easier to reason about and implement. I/Q as Real and Imaginary
In this complex signal, the real part is the in-phase (I) component, and the imaginary part is the quadrature (Q) component.
$$ z(t)=I(t)+jQ(t) $$From this, we can recover:
- Amplitude (envelope): \(\sqrt{I^2+Q^2}\)
- Phase: \(θ(t)=tan^{−1}(Q/I)\)
- Frequency (for FM): The rate of change of phase, i.e. \(\frac{dθ}{dt}\)
Sampling the SDR
A device like the RTL-SDR connects to the computer via USB and has it’s own library for interacting with the hardware. We can very quickly and easily query the hardware for a device handle, and tune the SDR and output I/Q samples to a buffer.
rtlsdr_dev_t* dev = NULL;
rtlsdr_open(&dev, 0);
rtlsdr_set_center_freq(dev, 96700000); // Heart FM
rtlsdr_set_sample_rate(dev, DEFAULT_SAMPLE_RATE); // 2.4Ms/s
rtlsdr_set_tuner_gain_mode(dev, 1); // Manual gain mode
rtlsdr_set_tuner_gain(dev, 400); // 40dB gain
Then, when we are ready to request samples from the device
uint8_t rtl_buf[RTL_FM_DEMOD_BUF_LEN];
int n_read;
rtlsdr_read_sync(dev, rtl_buf, RTL_FM_DEMOD_BUF_LEN, &n_read);
So, now we have n_read / 2 samples in the buffer, each 8-bit unsigned, interlaced I then Q, these represent complex baseband samples captured from the RF spectrum around your tuned frequency.
The I/Q in code
To process these samples, we first convert the unsigned bytes into signed values centered around zero. This is necessary because RF signals swing positive and negative around the carrier. Then we compute the phase angle of each complex sample using atan2():
for (int i = 0; i < n_samples; i++)
{
    int8_t i_sample = rtl_buf[2 * i] - 127;
    int8_t q_sample = rtl_buf[2 * i + 1] - 127;
    phase[i] = atan2(q_sample, i_sample);
}
Imagine plotting the complex number \(z[n]=I[n]+jQ[n]\) as a point on a 2D plane, x-axis = I (real part) y-axis = Q (imaginary part). Now draw a line from the origin to that point. The angle that line makes with the x-axis is the phase of the signal, and that’s exactly what \(atan2(q, i)\) gives you, a simple geometric intuition.
Now we have a new buffer, representing the phase angle of each sample, now what?
Demodulation
For frequency modulation, the sound waves are encoded in how fast the phase is changing. The more rapidly the signal’s phasor rotates, the higher the frequency, and thus the higher the pitch of the demodulated audio. So to demodulate FM then, all we need to do is take the difference in phase between successive samples and we will be left with the audio!
static float prev_phase = 0;
for (int i = 0; i < n_samples; i++)
{
    float dphi = iq_buf[i] - prev_phase;
    // keep dphi within -pi and pi (as phase is circular)
    if (dphi > M_PI)
        dphi -= 2 * M_PI;
    if (dphi < -M_PI)
        dphi += 2 * M_PI;
    iq_buf[i] = dphi;
    prev_phase = iq_buf[i];
}
Audio recovery
To recover the audio as the broadcaster intended, a few more things need to take place before you can just send ALSA those samples, We have audio-ish data, but it’s: noisy, too fast (e.g., 2.4Ms/s) and raw. So we need to clean it up and bring it down to a usable rate like 48 kHz:
- Low-pass filter - to isolate the audio frequencies
- Decimate - downsample the filtered signal (e.g., by a factor of 50), You could do this yourself with a FIR filter and a decimation loop, or use something like libresample to handle it. (or do as I did, and simply discard 49/50ths of the samples!)
Radio stations also emphasise the high-frequency components of the sound, so applying a de-emphasis filter is also necessary. The pre-emphasis curve is standardised (e.g. 50µs in Europe, 75µs in the US), your deemphasis filter should match that exactly.
So… You’ve done all that, and your audio sounds like this…
Well that’s not right?
The answer lies in many areas that we have glossed over here, most notably that we are applying demodulation to the entire 2.4MHz sample range, that means we are probably hearing a bunch of other radio stations, and a few megahertz of the noise floor, channel filtering before demodulation is essential. Perhaps filtering is a topic for another day?
That’s what the same station should have sounded like… Thanks SDR++
Footnotes
- When I wrote that the RTL-SDR gives samples of the baseband, that was a simplification, the RTL-SDR performs quadrature sampling with a tunable IF, not true DC baseband. The signal is typically centered near 0 Hz in software, but depending on tuner settings, the actual hardware may shift it to a low IF like 1 MHz. (Although for RTL2832U with direct sampling, it can be closer to baseband.)
- The real DC offset of the RTL-SDR is not 127, it’s closer to 127.4
- When I say “baseband”, I mean complex baseband (centered around 0 Hz), not real baseband (as in regular AM audio).
- When I wrote \(θ(t)=tan^{−1}(Q/I)\), I used
tanas a simplification, you would useatan2because it accounts for quadrant ambiguity.
Check out the code for this on My GitHub